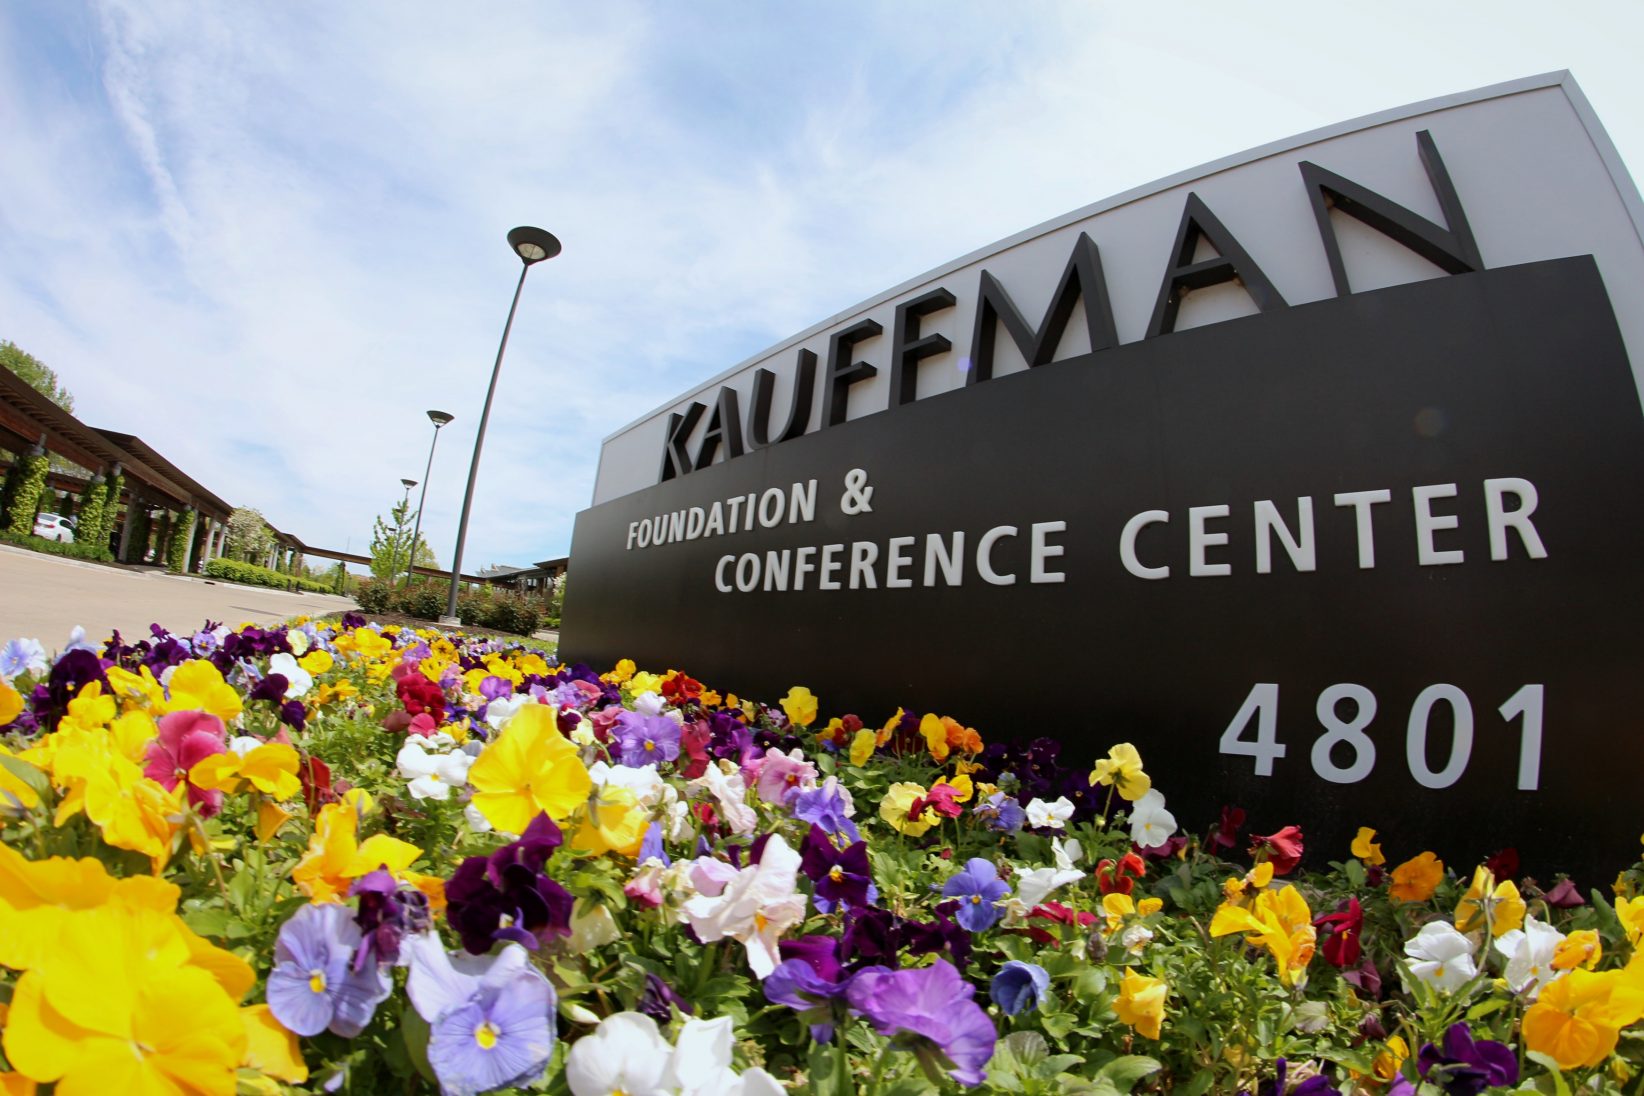
For the third year in a row, U.S. entrepreneurial ventures are growing, indicating that domestic entrepreneurship growth has rebounded since the Great Recession, according to the Ewing Marion Kauffman Foundation.
The “2016 Kauffman Index of Growth Entrepreneurship” found the improvement was in large part thanks to startups growing faster in their first five years than they were in previous years, and more young firms scaling up employment. This year’s improvement marks the largest year-over-year increase in the past decade.
“High growth, particularly among young firms, is an important contributor of jobs, output and productivity growth,” said Arnobio Morelix, senior research analyst at the Kauffman Foundation. “Younger entrepreneurial firms again are contributing more broadly to business and job growth. While the indicators show that growth is still below the historical norms before the Great Recession, a third consecutive year of gains is an encouraging sign. In the past two years alone, these growing young companies created an estimated 200,000 jobs in the economy.”
The index analyzes three main indicators: rate of startup growth; share of scale-ups; and high-growth company density. Tracking growth in entrepreneurship helps researchers understand what drives job creation, innovation and wealth creation in the U.S. economy.
Here are three takeaways from the index:
The rate of startup growth is up. On average, U.S. startups in their first five years grew 58.5 percent in the employment ranks in 2013, the most recent year for which data are available. The average U.S. startup from 2008 grew from 5.8 employees to 9.2 employees after five years of operation, according to the index.
The “Share of Scaleup” firms has also grown. That metric, which looks at the percentage of companies that grow to employ at least 50 people in the first 10 years after founding, increased in 2013 to 1.1 percent, according to the index. That means about 1,100 companies out of every 100,000 firms 10 years of age and younger started small and reached a scale of more than 50 employees. Researchers say the most recent numbers show that “Share of Scaleups” remains below the historical range of 1.2 percent to 1.4 percent that the U.S. experienced through most of the 1990s and the first part of the 2000s.
High-growth company density has increased since the Great Recession. The metric looks at the number of U.S. private businesses with at least $2 million in annual revenue reaching three years of 20 percent annual revenue growth. In 2015, researchers found that this indicator plateaued at 79.3 high-growth companies for every 100,000 employer businesses — a marked improvement since the economic downturn. Despite the recent plateau, high growth as measured by revenue has increased from the levels seen during the Great Recession.
For more data from the index check out the foundation’s index site.


